Interpreting the LR Model
tags: #ML/supervised/regression
A statistically significant coefficient indicates that there is an association between the predictor (x) and the outcome (y) variable. This is visually indicated by the asterisks to the right of the output for each predictor, each corresponding to a specific level of significance.
* - 0.05
** - 0.01
*** - 0.001
Sample Output:
                            OLS Regression Results
==============================================================================
Dep. Variable:               response   R-squared:                       0.850
Model:                            OLS   Adj. R-squared:                  0.840
Method:                 Least Squares   F-statistic:                     84.54
Date:                Sun, 24 Apr 2023   Prob (F-statistic):           4.69e-22
Time:                        12:00:00   Log-Likelihood:                -247.43
No. Observations:                  50   AIC:                             502.9
Df Residuals:                      46   BIC:                             510.0
Df Model:                           3
Covariance Type:            nonrobust
==============================================================================
                 coef.    std err          t      P>|t|      [0.025      0.975]
------------------------------------------------------------------------------
const         14.5802      6.452      2.258      0.029       1.538      27.622
predictor1     0.6568      0.103      6.392      0.000       0.449       0.864
predictor2     0.4647      0.118      3.933      0.000       0.226       0.703
predictor3    -0.0006      0.001     -0.452      0.654      -0.003       0.002
==============================================================================
Omnibus:                        0.044   Durbin-Watson:                   1.811
Prob(Omnibus):                  0.978   Jarque-Bera (JB):                0.201
Skew:                          -0.031   Prob(JB):                        0.905
Kurtosis:                       2.648   Cond. No.                     8.36e+03
==============================================================================

Notes:
[1] Standard Errors assume that the covariance matrix of the errors is correctly specified.
[2] The condition number is large, 8.36e+03. This might indicate that there are
strong multicollinearity or other numerical problems.
1. Estimated Regression Coefficient b
The regression coefficient of the IDV is represented by the parameter
This means that for every unit increase in the IDV, the DV increases/decreases by the value of the regression coefficient (depending on the sign of the coefficient).
There are two ways in which parameter,
-
Unstandardized (regression) coefficient - which is the parameter value used in the regression model for its respective independent variable
-
Standardized (regression) coefficient ("
beta") - which are the value of the regression coefficients you would get if the variables in the regression were all converted to z-scores before running the analysis.
beta? How do we interpret it?
Beta is measured in SD units i.e., it indicates that for every 1 unit of change in the SD to the IDV, there is a beta-value SD unit change to the DV.
In short: the beta coefficient is the degree of change in the outcome variable for every 1-unit of change in the predictor variable.
beta?Standardized regression coefficients allow you to compare the strength of the effect of each individual IDV to the DV:
- The absolute value of beta can tell you which IDV is the strongest predictor of DV.
- The higher the absolute value, the stronger the effect.
Example:
			Equation 1				Equation 2
			----------				----------
			b	  beta				b	 beta
			-----------------------------------
Education  0.076* 0.220.           0.041* 0.

Dependent Variable: Self-reproted health
Independent Variable: Education
- The estimated regression coefficient for education is 0.076
- This means that with each additional year of education, the DV (self-reported health) increases, on average, by 0.076 points, while controlling for all other IDVs (we say increases because the coefficient is a
positive value).
- Notice the asterisks by the coefficient
this indicates that the variable, education, is statistically significantfrom 0 at a significance level of 0.05.
2. Estimated Regression Coefficient b (Dummy)
When reporting the regression coefficients of DV - you are making DIRECT comparisons to the reference group (the group that is omitted).
Example:
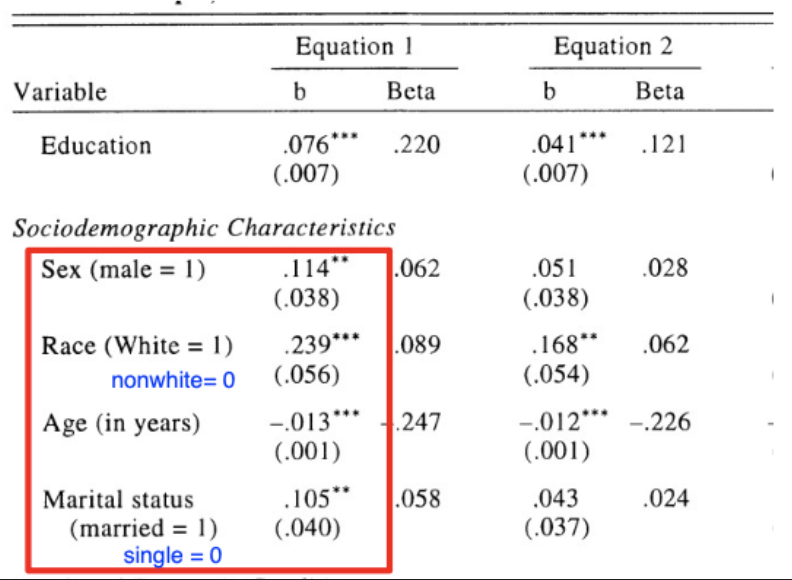
Categorical Variable:
-
Sex - Males have a self-rated health that is on average 0.114 HIGHER than females
-
Race - Whites have a self-rated health that is about 0.239 points HIGHER than non-whites
-
Marital Status - Married people have a self-rated health that is 0.105 points HIGHER than that of single people.
3. Y-intercept (constants)
The y-intercept (or constant) represents:
- The mean value of the response i.e., DV variable, when all quantitative independent variables (predictors) in the model are 0.
It also represents the:
- The mean value of the response i.e., DV variable, when all categorical independent variables (predictors) in the model are at reference level (omitted category).
4. t-value
t-tests are used to test the statistical significance of the coefficients in a linear regression model:
For each regression output, there is a corresponding t-value associated with each variable to assess whether the regression coefficient is significantly different from zero.
5. Coefficient of Determination (
The most common measure of how accurate the model (prediction) is, is the Coefficient of Determination (R2) (i.e., how good is the model in making predictions?)
This is measured as:
where,
SSE (regression)- is the sum of squared errors produced by the least squares equation that you are evaluating.
SSE (mean only)- sum of squared errors for a least squares equation WITHOUT the IDV.
This reflects the proportional of the total variation in the DV, explained by the IDV(s) in the MLR model.
R2 will ALWAYS increase as variables are added to the model
R2 ranges from 0.0 to 1.0 such that:
1.
- Reduced the uncertainty by 100% - all observations fall on the line and is a perfect fit for the data
- Independent variable(s) in the model account for 100% of the variation in the DV
- All observations fall on the regression line and prediction error = 0.0
2.
- This indicates a POOR FIT or a well-fitting line with
(i.e., a slope of 0). - A well-fitting fitting line must have a non-zero slope for
.