Interpreting Decision Tree Output
tags: #ML/supervised/classification/trees
To build a graphical representation of a decision tree in Python, you can use the graphviz library along with the scikit-learn library for creating and visualizing decision trees.
Note: Ensure that graphviz is installed
# install graphviz
pip install graphviz
Sample code for building a decision tree graph:
import graphviz
from sklearn.tree import DecisionTreeClassifier
from sklearn import tree

# Assuming you have a pandas DataFrame called df
X = df[[list_of_features]]
y = df["target_column"]

# Create a decision tree classifier
clf = DecisionTreeClassifier()
clf.fit(X, y)

# Visualize the decision tree
dot_data = tree.export_graphviz(clf, out_file=None,
                                feature_names=df.columns, # list of features
                                class_names=df["target_column"].unique(),
                                filled=True, rounded=True,
                                special_characters=True)

graph = graphviz.Source(dot_data)
graph.render("decision_tree")  # Save the tree as a PDF or any other format

# Display the decision tree
graph.view()
Interpreting the Decision Tree
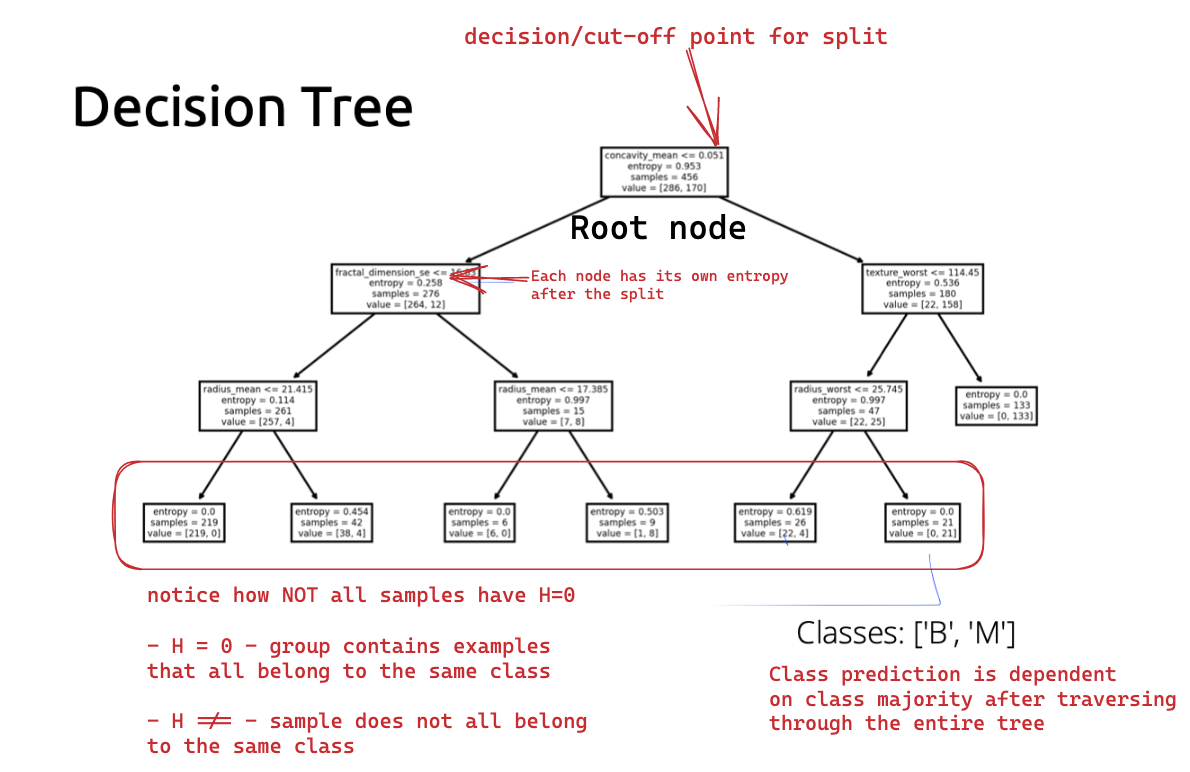
Entropy
Entropy may temporarily increasing during the tree building process; this is OKAY! The goal is to minimize entropy in the long-run (i.e., overall tree).
Therefore, if the entropy increases at some point during the building process, it is not necessarily a problem as long as the entropy decreases enough in subsequent splits such that the final entropy is LOWER than the initial entropy.