3. Two-way ANOVA
tags: #statistics/inferential/anova/two_way
What is Two-way ANOVA?
A two-way ANOVA (Analysis of Variance) is an inferential statistical method used to determine the effect of two independent categorical variables (with three or more categories) on a continuous dependent variable.
- The two independent variables are referred to as the "main effects," and the interaction between the two variables on the DV is also tested.
- The aim of a two-way ANOVA is to determine whether the main effects or whether an interaction effect between explanatory variables have a significant impact on the dependent variable.
Theoretical Framework
Three hypotheses are being tested in two-way ANOVAs:
Null Hypothesis for Factor A: The mean response is the same across all levels of factor A while holding factor B constant, such that:
Null Hypothesis for Factor B: The mean response is the same across all levels of factor B while holding factor A constant, such that:
NullHypothesis for Interaction: There is no interaction between the two factors, such that:
There are two possible models for a two-way ANOVA depending on the outcome of the interaction term:
-
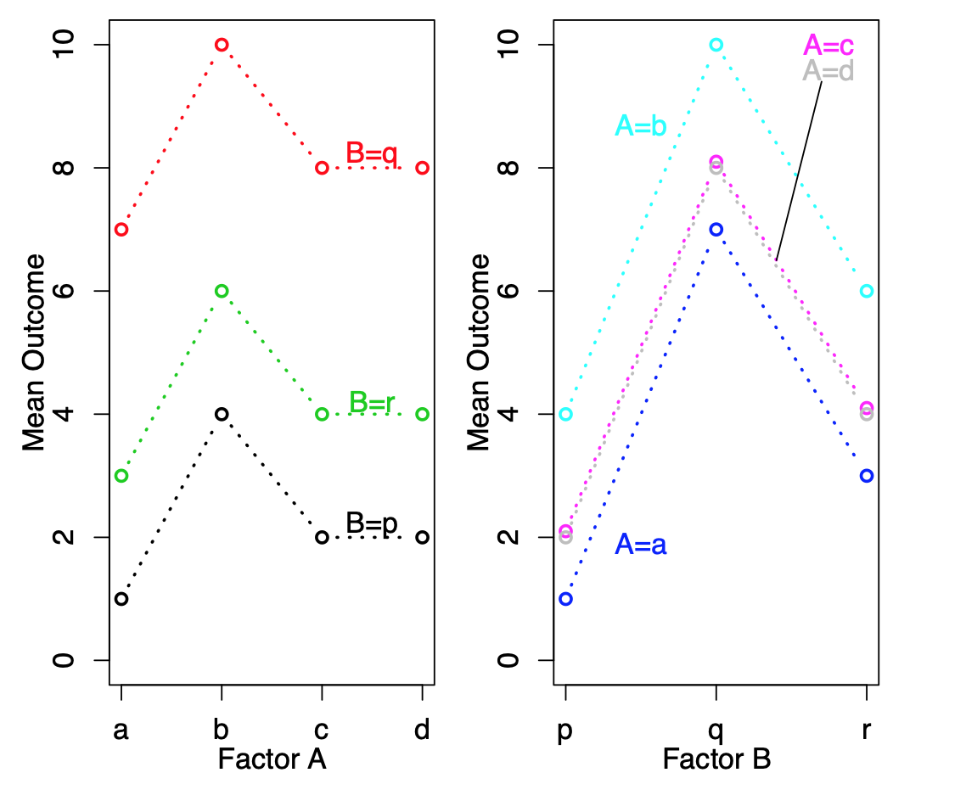
Additive Model - whereby, the interaction between the two factors are assumed to be 0, such that, the effect of any level of Factor A on the DV is the same for any FIXED level of Factor B. In an interaction plot, this is represented by parallel lines, example:
-
Interaction Model - whereby, the effect of Factor A on the DV is dependent on Factor B, such that the effect of any level of Factor A on the DV is different for any FIXED level of Factor B. This is illustrated in the interaction plot by presence of non-parallel lines (does not have to be all, but as long as there are non-parallel lines = presence of an interaction).
Running Two-way ANOVA in Python
Important to LOOK AT INTERACTION EFFECT BEFORE MAIN EFFECT!!!! We should be cautious about interpreting the main effects of a two-way ANOVA when we find a significant interaction effect.
If interaction is statistically significant, ignore p-values of main effects.
We can perform a two-way ANOVA using the anova_lm() function from the statsmodels library:
import statsmodels.api as sm
from statsmodels.formula.api import ols # allows users to fit statistical models using R-style formulas

#perform two-way ANOVA
formula = 'DV ~ factor1 + factor2 + interaction between the two' # expressed as factor1:factor2
model = ols(formula, data=df).fit()
results = sm.stats.anova_lm(model, type=2)

print(results)
                  sum_sq   df         F    PR(>F)
factor_A       34.228333   2.0  2.496681  0.101372
factor_B       35.682500   1.0  8.261726  0.018289
factor_A:B     87.785833   2.0  8.069296  0.003045
Residual      104.260000  54.0       NaN       NaN
Alternatively, we can do this with the f_oneway function:
import pandas as pd from scipy.stats
import f_oneway, pairwise_tukeyhsd

# Load the data into a pandas DataFrame
data = pd.read_csv('data.csv')

# Perform the two-way ANOVA
result = f_oneway(data['y'], data['A'], data['B'], data['A:B'])
Interpreting Results
To further visualize the interaction, we can use an Interaction Plot.
| Result | Action |
|---|---|
| Significant Interaction | Check the significance of the interaction term. If significant, reject the third hypothesis and proceed to perform simple main effect tests. |
| Insignificant Interaction | Run the analysis without the interaction term as an additive model. Interpret each of the p-values as in one-way |
If interaction term is significant:
- Do not interpret the main effects
- Do not conduct post-hoc[2]
- Explore Interaction to see how the means of the dependent variable differ across the levels of the two independent variables using Interaction Plot
If interaction term is insignificant
- We can interpret the main effects of each independent variable and use Tukey's HSD test to perform multiple comparisons of the means between the groups.
https://statisticsbyjim.com/regression/interaction-effects/ ↩︎
Can still perform post-hoc, but it is important to keep in mind that the results of the post-hoc tests may be more difficult to interpret in the presence of a significant interaction term. It may be useful to plot the means for each group to better understand the interaction pattern before conducting post-hoc tests. ↩︎