2. One-way ANOVA
tags: #statistics/inferential/anova/one_way
What is a One-way ANOVA?
One-way ANOVAs is a bivariate inferential statistic technique that involves:
- A continuous dependent variable
- A categorical independent variable with three or more groups
This is used to to compare the difference between the means of a continuous dependent variable across three or more independent groups of a SINGLE categorical variable.
This is also known as: one-factor analysis or between subject ANOVA.
Scenario 1: Does exam performance (measured from 0 to 100) differ based on test anxiety levels (low, moderately, highly stressed levels) amongst students?
- Continuous DV: Exam Performance
- Categorical IV: Anxiety Levels
Scenario 2: Is there a difference in salary based on degree subjects (e.g., business, psychology, biology, engineering, law)?
- Continuous DV: Salary
- Categorical IV: Degree Subject
Theoretical Framework
Hypothesis Model
- Null Hypothesis - states that there are NO DIFFERENCES in the population means between groups (i.e., the means are equal)
- Alternative Hypothesis - states that AT LEAST ONE population mean is different (i.e., they are not equal OR there is a difference in the population means between groups)
Sampling Distribution and Statistical Test: F-test
The F-test is used in ANOVAs to test the statistical significance of the differences among the means of three or more groups.
The F-test uses the F-distribution to determine the probability of obtaining a test statistic as extreme or more extreme than the one observed, assuming that the null hypothesis is true .
Computing the test statistic
The F-statistic is the ratio of the variability between groups to the variability within groups.
- Refer to INF 1344 - W10L18 - Bivariate Analysis: One-way ANOVA for detailed explanations
-
The F-test is a statistical test that compares the ratio of the variability between groups to the variability within groups, which is the ratio of the mean square between (MSB) to the mean square within (MSW).
-
If the ratio of the between-group variability to the within-group variability is large enough, it is unlikely to have occurred by chance, and we can conclude that the means of the groups are significantly different.
-
In other words, when the
is large enough, we can be confident that differences between groups are greater than we'd expect by chance, and we can reject the null, such that:
This means that the larger the between group variance (MSB) than within (MSW), the larger the F-statistic, and greater the chance of rejecting the null.
Between Group
is the mean of the th group is the grand mean of all groups is the sample size of the th group, is the total number of groups.
Within Group
is the th observation in the th group, is the mean of the th group is the sample size of the th group - Take sum of the within group variation for each group
Interpreting the Results
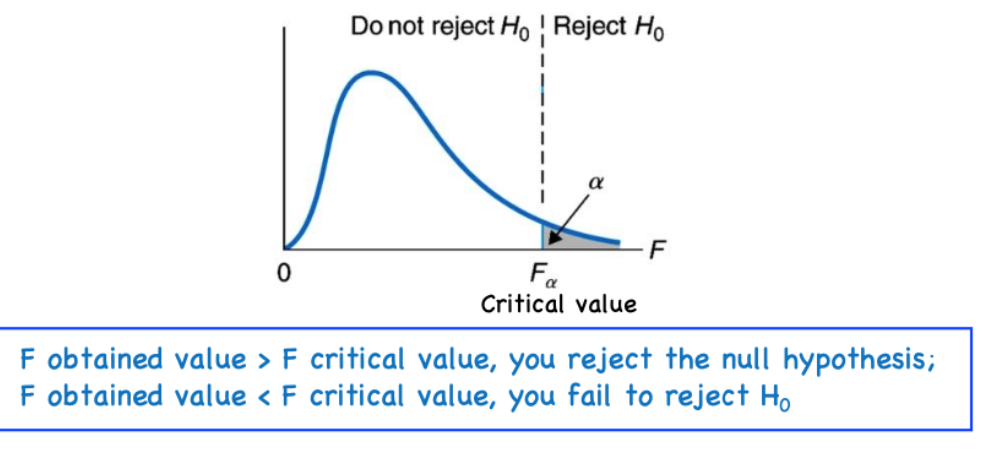
To determine whether to reject or fail to reject the null, we can compare the F-critical value from the F-distribution table (used to establish the critical region for rejection) to the observed F statistic:
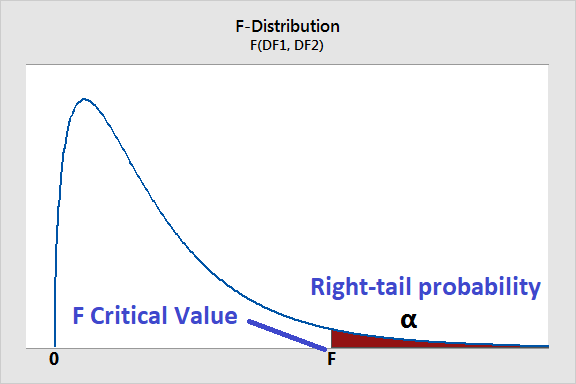
We can find the F-critical value using the F-table corresponding to the level of significance level, based on:
- The dof between groups (COLUMN), and
- The dof within groups (ROW)
The F-critical value determines the critical region (i.e., sets the threshold for rejection) in the F-distribution:
Running One-way ANOVA in Python
Method 1: Using SciPy
We can conduct a one-way ANOVA test in Python using the f_oneway function from scipy.stats:
# import function
from scipy.stats import f_oneway

# Conduct One-way ANOVA
f_oneway(*samples) # there must be at least two array-like arguments (i.e., samples)

# in the context of a dataset after subsetting for relevant features
# retrieving the raw data values of the DV for "group_1"
sample_1 = df[df["Categorical_Var"]=="group_1"]["DV"]
This returns a tuple of the F-statistic and the corresponding p-value computed at
F_onewayResult(statistic, pvalue)
To run and display the test statistic and p-value using tuple unpacking:
statistic, pvalue = f_oneway(*samples)

print(f'One-way ANOVA: s = {statistic}, p = {pvalue}')
One-way ANOVA: s = 93.73300962036718 (F-statistic), p = 2.1376700154385954e-28
Method 2: Using statsmodel
Alternatively, we can use statsmodel which includes a summary output:
import statsmodels.api as sm
from statsmodels.formula.api import ols

# assume your data is stored in a pandas dataframe called 'df'
# with the dependent variable 'y' and the independent variable 'x'

model = ols('y ~ x', data=df).fit()
anova_table = sm.stats.anova_lm(model, type=2)
Note that the ols function will automatically group the data by the categorical IV and compute the mean of DV for each group, so you don't need to do any pre-processing of the data.
If results are significant, follow up with: Post-Hoc Tests