Introduction to ANCOVA
tags: #statistics/inferential/anova
Introduction to ANCOVA
What is the ANCOVA?
ANCOVA is the Analysis of Covariance.
It is used to study the effect of two independent categorical variables on a continuous dependent variable (and its interaction), while controlling for other selected continuous variables.
What is the covariance?
The covariate is not an independent variable of interest, but rather a secondary independent variable that is still measured and included in the model because it is believed to have an effect on the dependent variable.
The covariate is typically continuous (interval or ratio scale) and measured on the same individuals as the primary independent variable(s) and dependent variable.
If there are no covariates, use ANOVAs.
Suppose we found that boys and girls differ on math achievement. However, this could be due to the fact that boys take more math courses in high school. ANCOVA allows us to adjust the math achievement scores based on the relationship between number of math courses (covariate) taken and math achievement.
What is the difference from ANOVA?
- Is just an extension of ANOVAs, but it enables you to add a control variable (i.e., the covariance).
- Allows you to control for the linear effect of a variable on the DV that is not interest.
- We are still analyzing the relationship between primary IV(s) and the dependent variable.
Controlling for the covariate can increase the statistical power of the test.
How do we select for the covariate?
ANCOVA follows similar as ANOVA, with the addition of the following:
- Linearity assumption: At each level of categorical independent variable, the covariate should be linearly related to the dependent variable. If the relationship is not linear, the adjustment made to covariate will be biased.
- Homogeneity of Regression Slope: There should be no interaction between the categorical independent variable and covariate i.e. the regression lines between the covariate and dependent variable for each group of the independent variable should be parallel (same slope)
Hypothesis Model
The null hypothesis and the alternative hypothesis for ANCOVA are similar to those for ANOVA (both one-way and two-way).
Conceptually, however, these population means have been adjusted for the covariate.
Therefore ,the null hypothesis of ANCOVA is just "There is no significant difference in the mean response across all groups, while controlling for the covariate".
Navigation
Assumption of Linearity
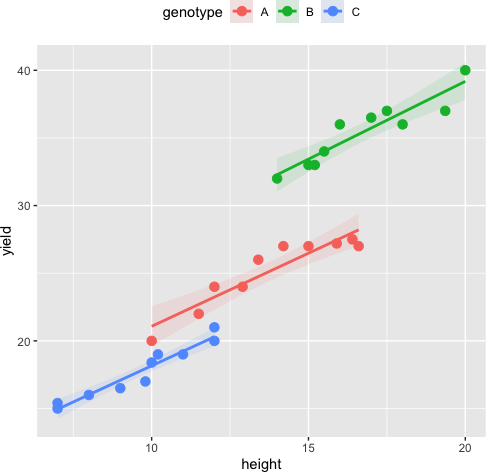
The relationship between the covariate and the dependent variable at each group of the independent variable should be linear. The scatterplot of covariate and dependent variable at each group of the independent variable can be used to assess this assumption. The data points should lie on the straight line to meet the linearity assumption.
# Generate scatterplot
sns.lmplot(x="covariate", y="dependent_variable", hue="group", data=df)
If the scatterplots show a non-linear relationship, then a transformation of the covariate may be necessary to meet the assumption of linearity.
Example:
Assumption of Homogeneity of Regression Slopes
Homogeneity of regression slopes refers to the assumption that the relationship between the covariate and the dependent variable is the same across all levels of the independent variable in an ANCOVA.
This assumption an be checked with an F-test on the independent categorical variable and the covariate using interaction terms between IV and covariate in ANOVA. There should be no interaction between the categorical independent variable and covariate.
To check for the interaction between the categorical independent variable and the covariate in ANCOVA, we can include an interaction term between the two in the ANCOVA model and test whether it is significant or not. The interaction term can be added to the model using the ols formula notation in Python libraries such as statsmodels:
import statsmodels.api as sm
from statsmodels.formula.api import ols

model = ols('dependent_variable ~ group + age + group:age', data=df).fit()
results = sm.stats.anova_lm(model, type=2)
In this model, "group:age" represents the interaction term between "group" and "age". If the interaction term is significant, it indicates that the relationship between the covariate and dependent variable varies across the levels of the independent variable, violating the assumption of no interaction.