Power Curves
tags: #statistics/inferential
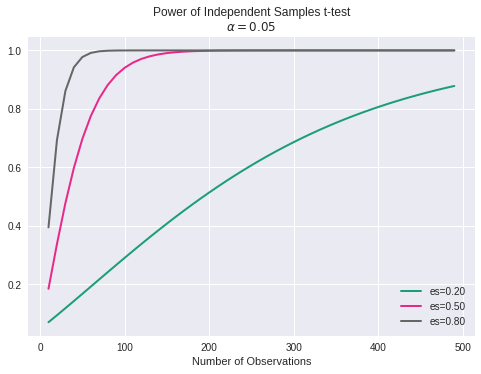
We can create plots that can show us how the power to find an effect varies as a function of effect size and sample size, given the alpha significance level at which the test is to be conducted at.
This can be done by using the .plot_power() function by first importing the necessary libraries and instantiating the desired power function corresponding to the statistical test:
import statsmodels.stats.power as smp
import matplotlib.pyplot as plt
To instantiate the power function:
power_analysis = smp.<POWER FUNCTION>
Generate an array of sample sizes and effect sizes:
effect_sizes = np.array([0.2, 0.5, 0.8])
sample_sizes = np.array(range(10, 500, 10))
Plot:
plt.style.use('seaborn')
fig = plt.figure()
ax = fig.add_subplot(1, 1, 1)
fig = power_analysis.plot_power(
dep_var='nobs', nobs=sample_sizes, # The x-axis is defined by the `dep_var` argument
effect_size=effect_sizes, alpha=0.05, ax=ax,
title='Power of Independent Samples t-test\n$\\alpha = 0.05
Sample Output:
)
Sample Output:
