1. Group By Aggregation
What is the groupby() function?
The groupby() function allows you to group data based on selected attributes (one or more columns), Different aggregate functions can be applied to each group independently.
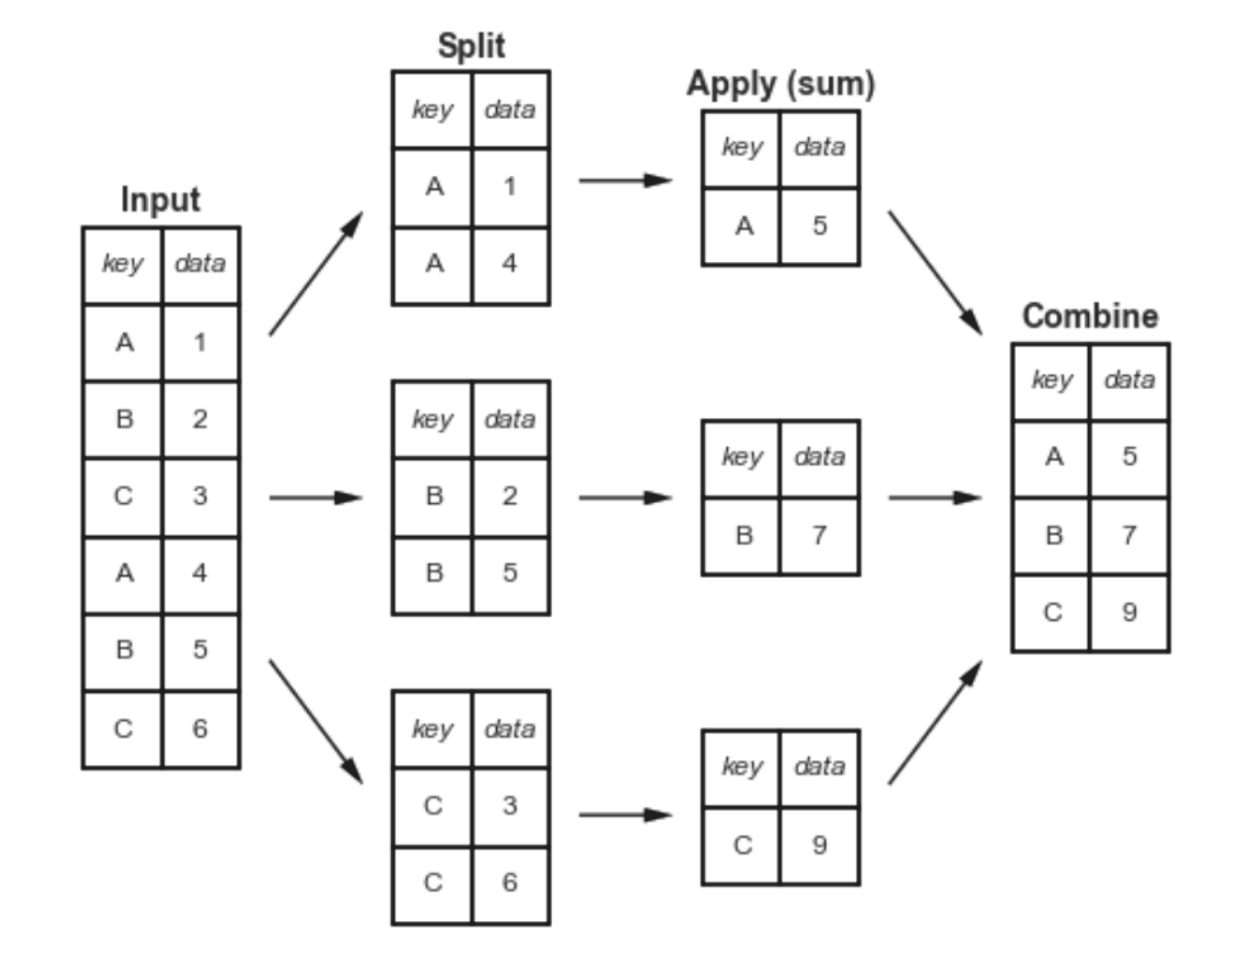
The function uses a split-apply-combine approach to aggregate (group) data and apply some sort of function on a group level:
-
The split step involves breaking up and grouping a
DataFramedepending on the value of the specified key. -
The apply step involves computing some function, usually an aggregate, transformation, or filtering, within the individual groups.
-
The combine step merges the results of these operations into an output array.
We can aggregate grouped data by call the function directly on the grouped object:
df.groupby('Column').agg_function()
| Aggregation Function | Brief Description | General Syntax |
|---|---|---|
| sum() | Returns the sum of values in each group. | df.groupby('column').sum() |
| mean() | Calculates the average of values in each group. | df.groupby('column').mean() |
| count() | Counts non-NA/null values in each group. | df.groupby('column').count() |
| min() | Returns the minimum value in each group. | df.groupby('column').min() |
| max() | Returns the maximum value in each group. | df.groupby('column').max() |
| std() | Calculates the standard deviation in each group. | df.groupby('column').std() |
| var() | Returns the variance of values in each group. | df.groupby('column').var() |
| first() | Returns the first value in each group. | df.groupby('column').first() |
| last() | Returns the last value in each group. | df.groupby('column').last() |
| median() | Returns the median of values in each group. | df.groupby('column').median() |
| describe() | Returns the descriptive statistics of each group. | df.groupby('columns').describe() |
| To return specific statistics | df.groupby('column').describe()'count', 'mean' | |
| prod() | Returns the product of values in each group. | df.groupby('column').prod() |
| size() | Returns the size of each group (including NaN). | df.groupby('column').size() |
| agg()* | Allows multiple aggregations at once. | df.groupby('column').agg(['sum', 'mean']) |
| transform()* | Returns a DataFrame with the same shape after applying a function. | df.groupby('column').transform('mean') |
| apply()* | Allows applying custom functions to each group. | df.groupby('column').apply(custom_func) |
We can split the data on any of their axes as specified in the axis parameter:
#Vertical, Operation applied on rows (Default)
#This means you group the rows based on the values of the selected columns.
df.groupby(by='column', axis=0)

#Horizontal, Operation applied on columns (not common)
df.groupby(by='column', axis=1)
Special Aggregations
1. Multiple Aggregation with .agg()
The df.groupby().agg() function in Pandas enables multiple aggregation operations on a grouped DataFrame in a single step.
1.1. Applying Multiple Aggregation to Different Columns
df.groupby('column').agg({'column1': 'sum', 'column2': 'mean'})
- A
key:valuepair mapping is required to define what operation is performed to which columsn.
1.2. Applying Custom Aggregation with Lambda
- See also Lambda Expressions
- Alternatively, see Applying Custom Functions
df.groupby('column1').agg({'column2': lambda x: x.sum() / x.count()})
1.3. Applying Multiple Aggregation on a Single Column
df.groupby('column1')['column2'].agg(['sum', 'mean', 'max'])
- In this case, we are performing 3 different calculations on
column2based on the grouping ofcolumn1.
          sum  mean  max
Category
A           30  15.0   20
B           70  35.0   40
2. Applying custom functions
2.1. Custom Aggregations
Using UDFs and Lambda Expressions, we can create custom aggregation and apply custom transformation on each group in the DataFrame using .apply().
df.groupby('column').apply(custom_function)
.agg()?
.apply() is better at handling more complex operations.
Example:
| Index | Category | Value |
|-------|----------|-------|
| 0     | A        | 10    |
| 1     | A        | 20    |
| 2     | B        | 30    |
| 3     | B        | 40    |
# Custom function
def custom_sum(group):
    return group.sum()

result = df.groupby('Category')['Value'].apply(custom_sum)
print(result)
.groupby().apply()
- The
df.groupby('Category')splits the DataFrame into groups based on the Category column. This creates a GroupBy Object. - The series from each group under
['Value']is passed to the custom function, and returns a result for each group.
Category
A 30
B 70
Name: Value, dtype: int64
2.2. New Columns Based on Aggregation
df['new_col'] = df['col'].apply(custom_func())